Glossy UI Generator
Every polished product screen you see on Sage.com has to be recreated by a designer.
When marketing needs a new webpage, designers receive a screenshot of the product and rebuild it from scratch, following Sage's brand guidelines. Each screen takes around 30–60 minutes. Multiply that by several screens and multiple markets, and you're looking at hours, sometimes days, of repetitive work.
Role
Product & UX designer
Company
Sage, 2026
The idea
I saw an opportunity to make that process faster.
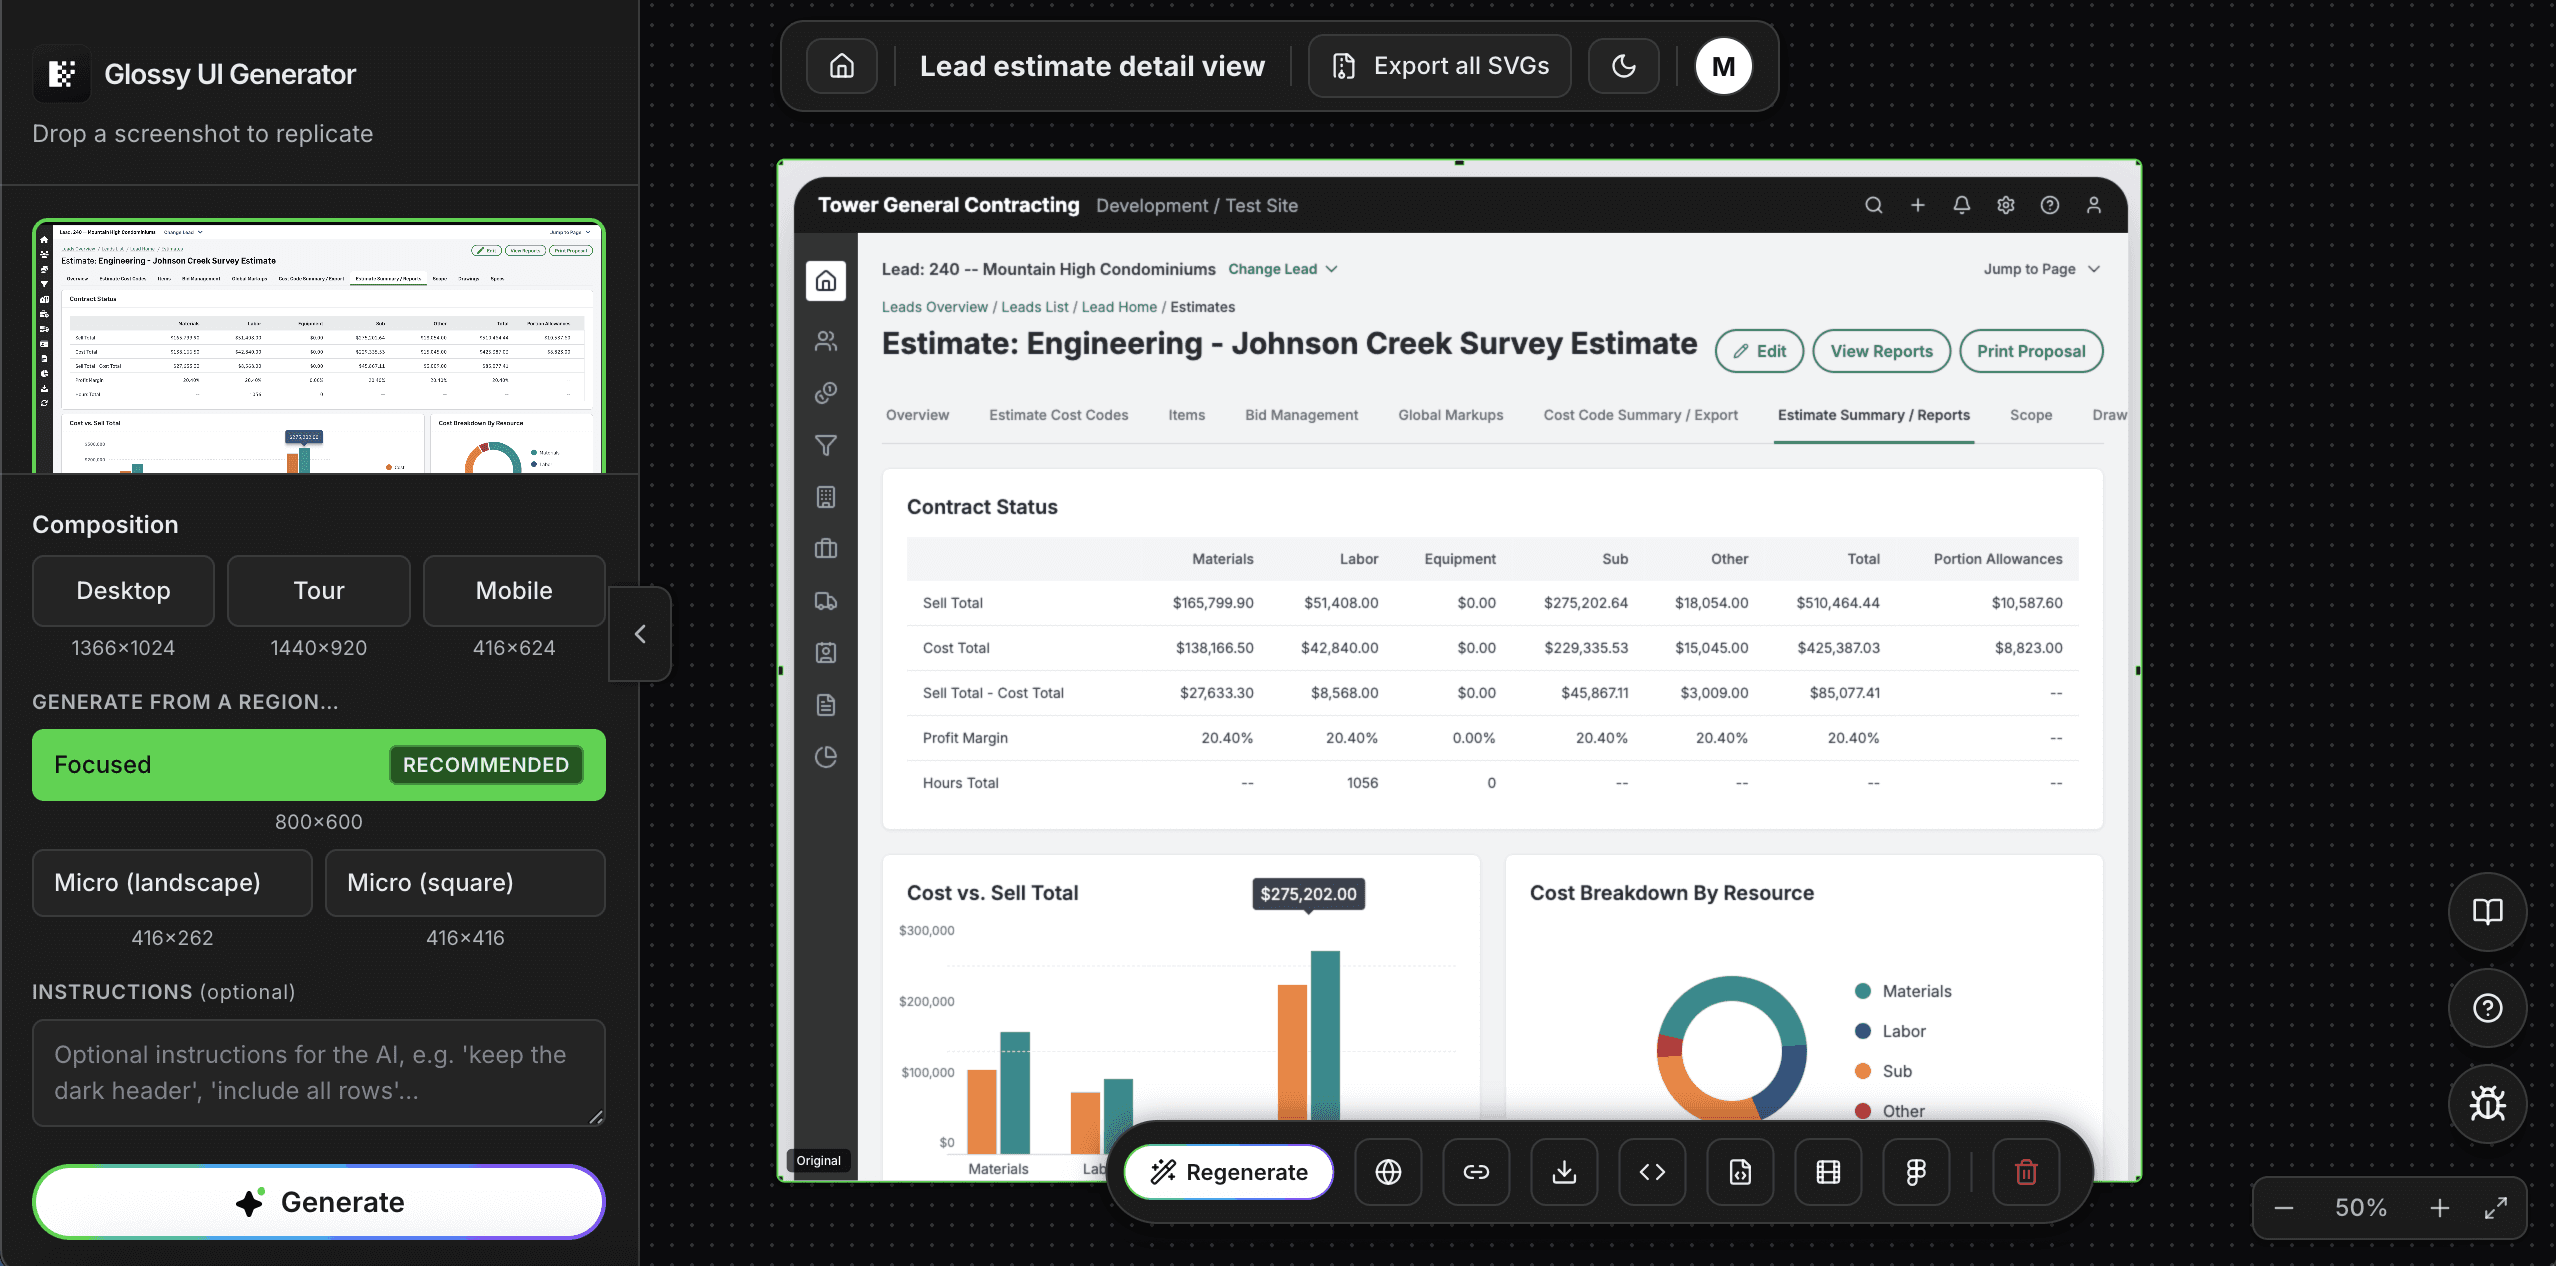
So I built the Glossy UI Generator: a tool that takes a raw product screenshot and turns it into a polished, on-brand marketing asset in about two minutes.
The challenge
The goal sounded simple: take a product screenshot and turn it into a marketing-ready visual.
The challenge was making sure the result actually looked like Sage.
Our glossy UI guidelines are very specific. There are five approved compositions, along with rules for typography, colours, border radii, shadows, and more. The output also needs to represent the original product accurately.
The tool couldn't just generate something that looked good. It had to follow the guidelines, preserve the product details, and produce an asset designers could edit, export, and localise.
The approach
My first idea was to use the existing Sage Carbon React components and design tokens to rebuild the screens.
The logic was straightforward:
- Recognise: Identify the existing components in the screenshot.
- Assemble: Rebuild the screen using the component library, filling in the gaps where needed.
- Review: Compare the result with the original screenshot.
But the first attempts didn't go as planned.
The AI interpreted the word "glossy" as a dark glass effect. What seemed obvious to us wasn't obvious to the model. I had to provide more precise instructions, examples, and rules to help it understand what a Sage glossy UI actually looks like.
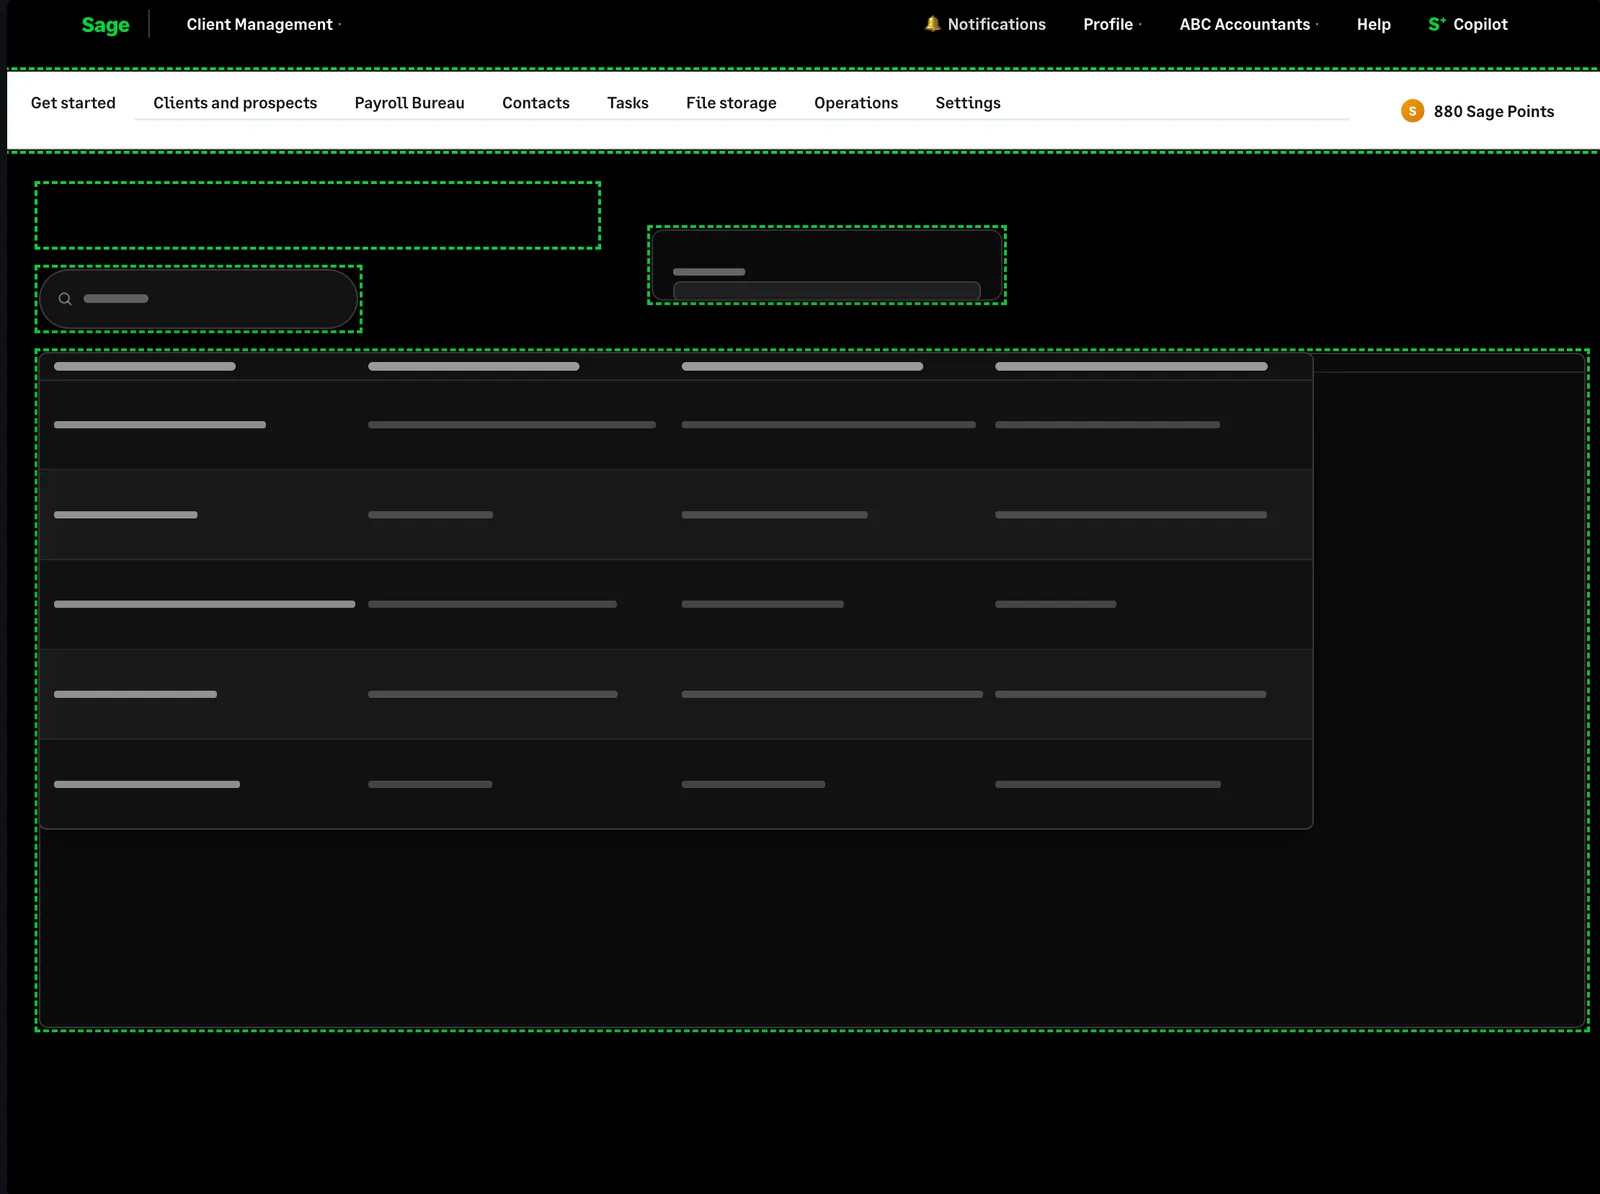
It took seven attempts to get one screen right. The first version lost important details in the rows. By the seventh attempt, the overall structure was much closer.
Then I ran into another limitation: the component library couldn't cover every possible screen. Missing components meant placeholders and gaps, and every new screenshot introduced more exceptions.
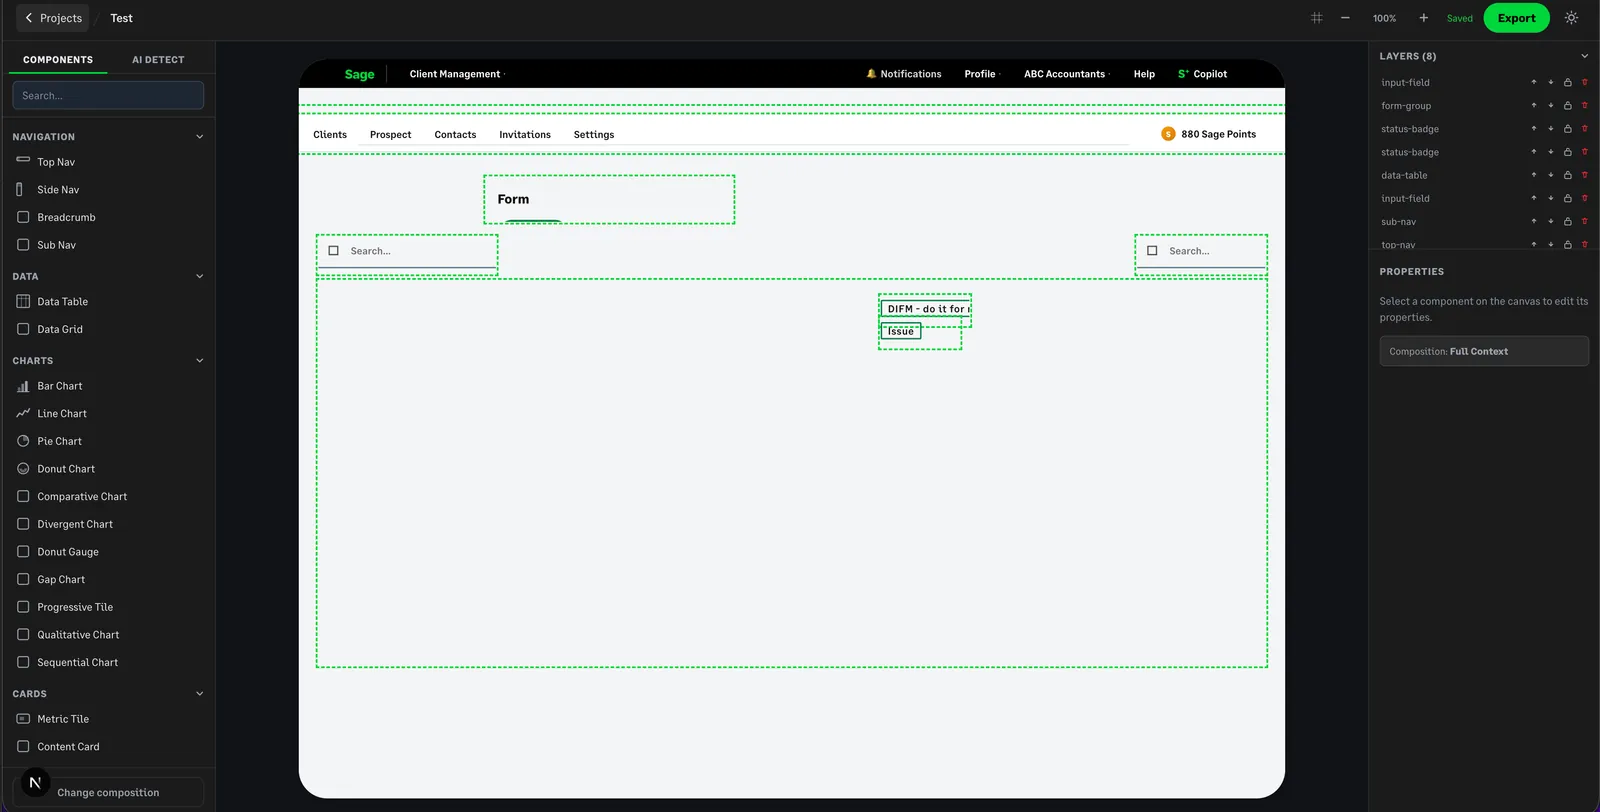
I had to rethink the approach.
PIVOT
The pivot
Instead of assembling individual components, I switched to generating the entire screen in HTML.
I gave the model the original screenshot, the glossy UI guidelines, and examples created by designers. This allowed it to recreate unfamiliar layouts without needing a matching component for every element.
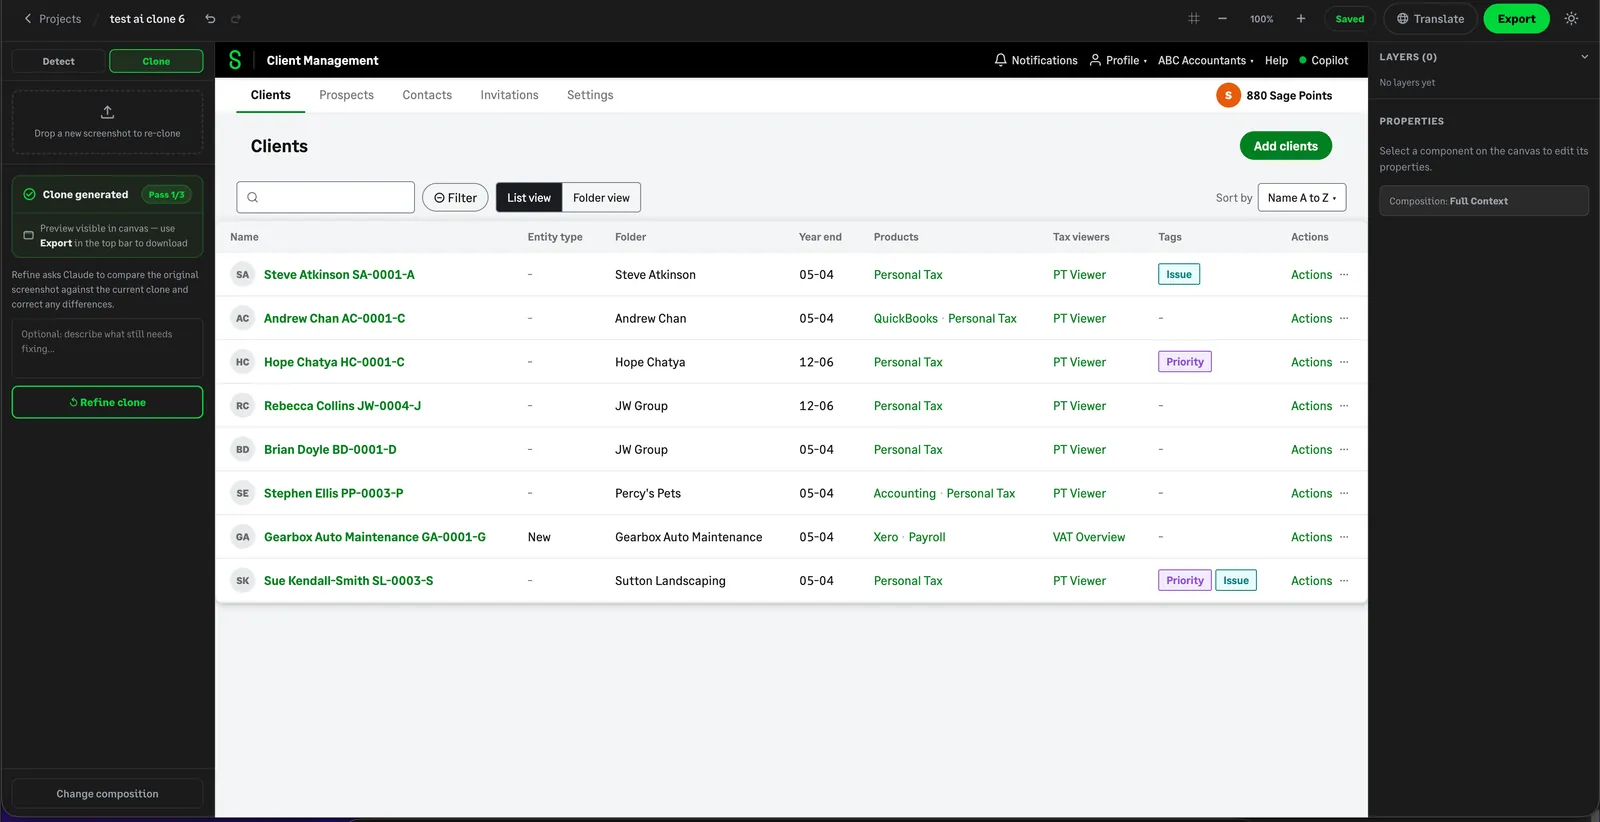
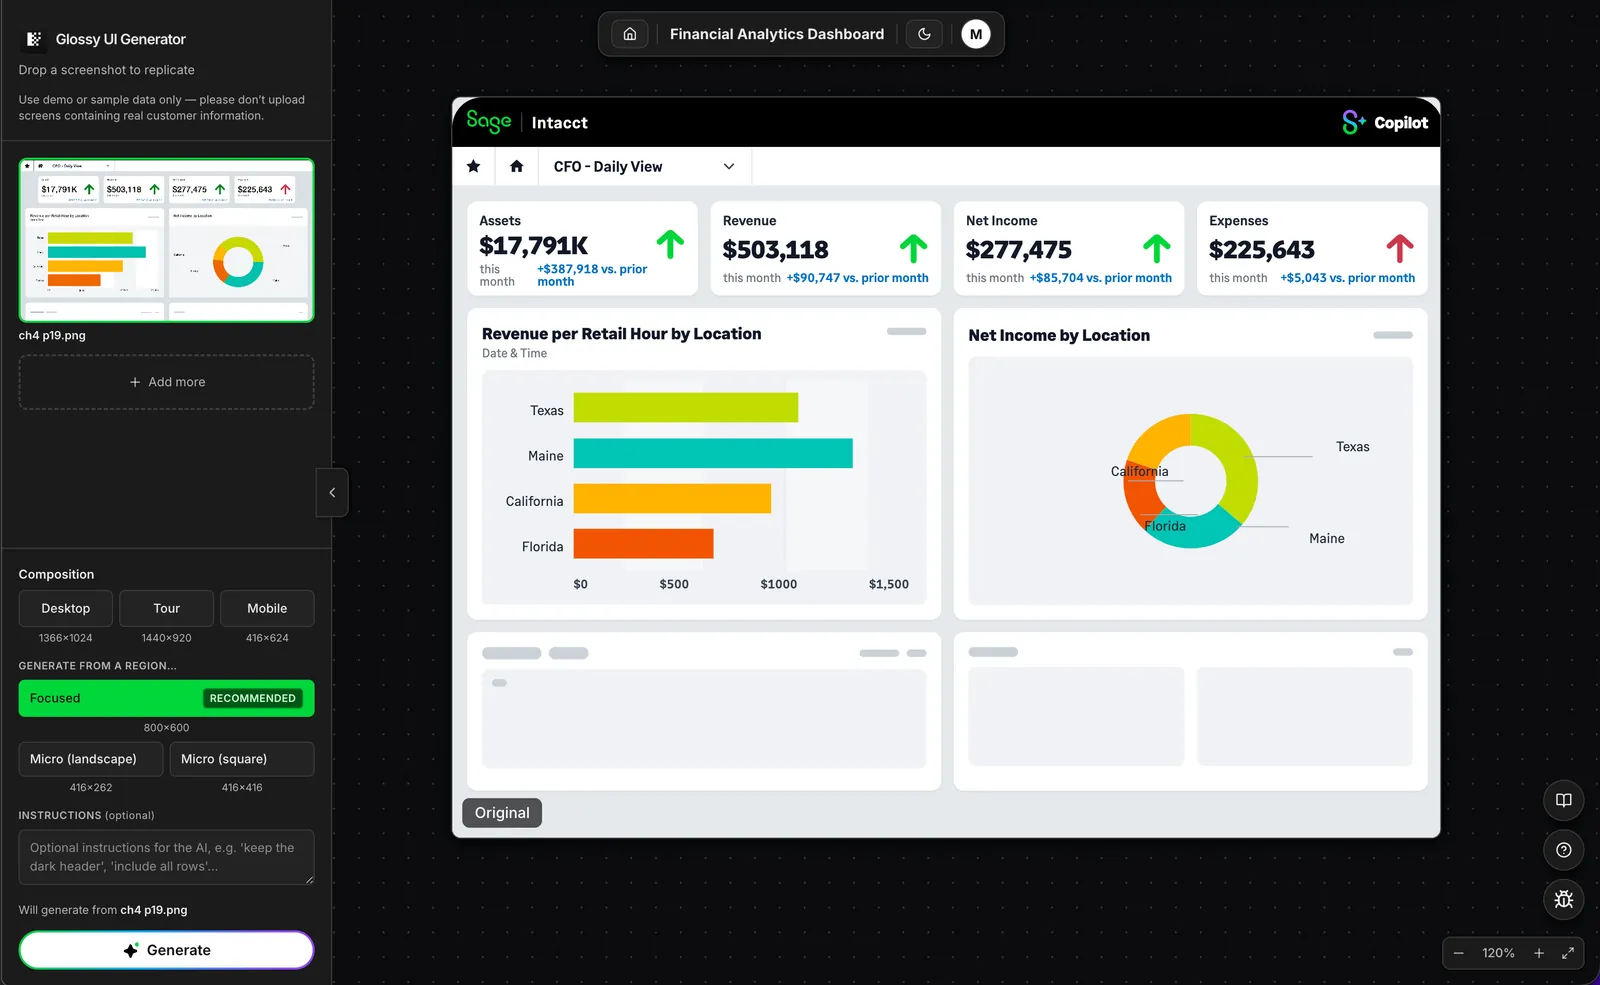
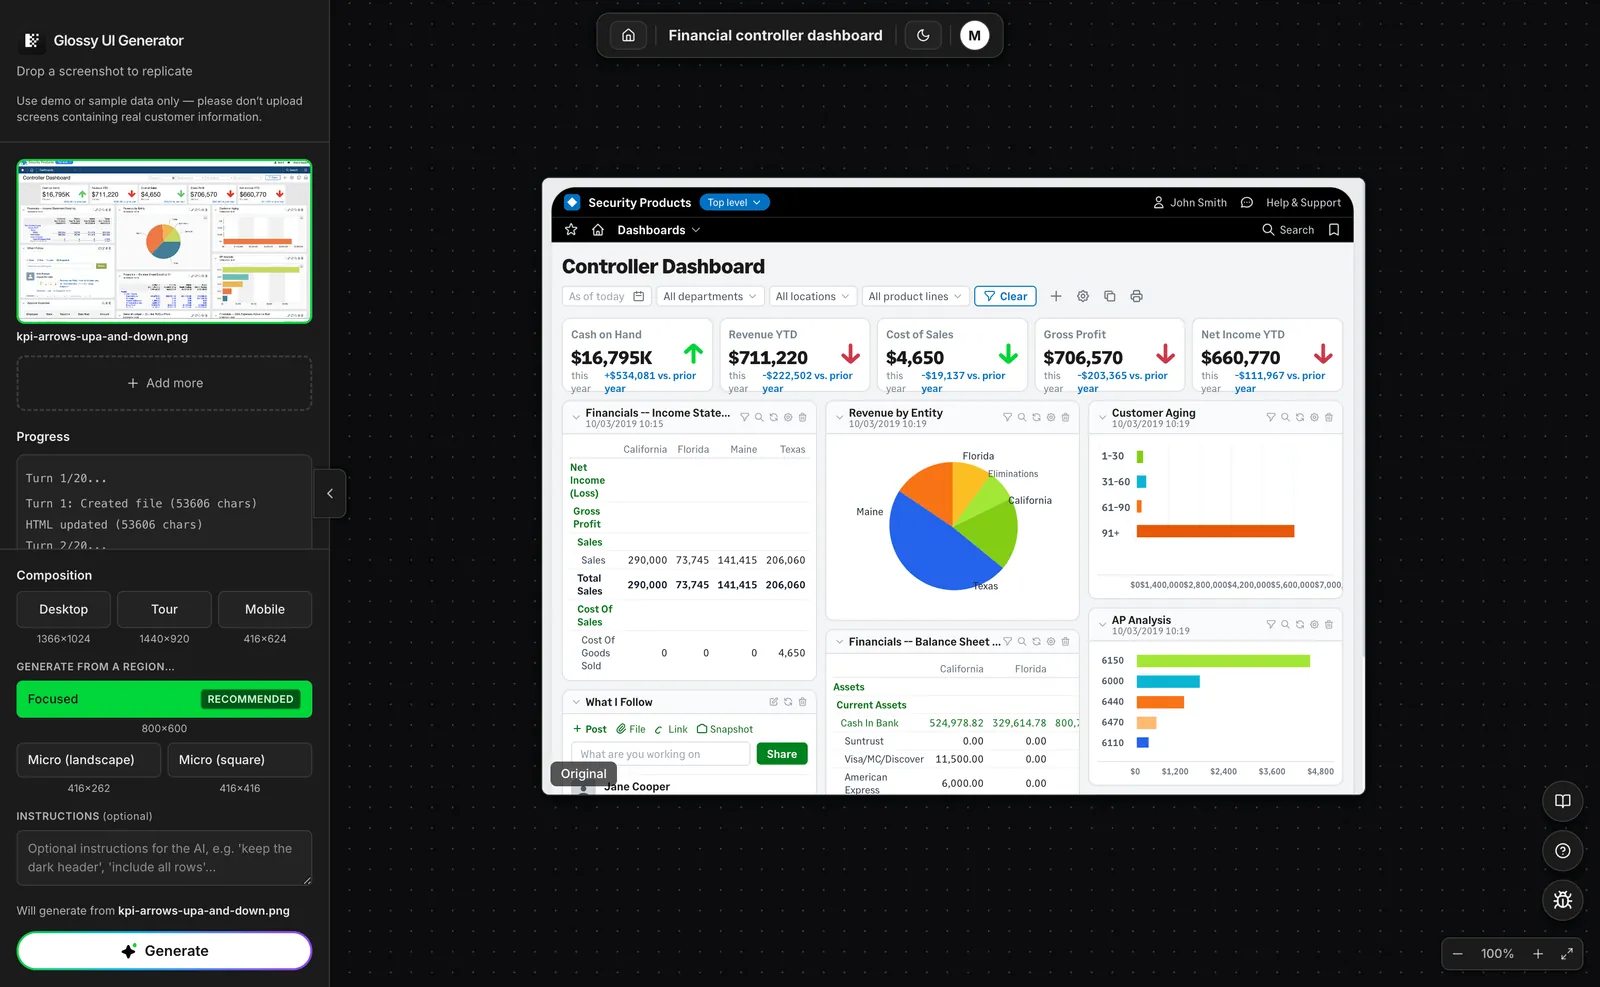
The results improved, but the process still needed human input. I had to compare the generated screen with the original, identify missing or invented details, and refine the output.
I'm a designer, not an engineer. I used Claude to help plan the approach and Claude Code to write the code. I tested every change before shipping it.
And when an approach kept making things worse, I stopped, documented what wasn't working, and tried something else.
The solution
The result is the Glossy UI Generator.
Upload a product screenshot, choose a composition, and generate a polished, on-brand screen in about two minutes.
The workflow includes:
- Generate: Upload, drag, or paste a screenshot and choose a composition. The Focused composition is the recommended default.
- Refine: Select an area of the screen and describe the changes you want to make.
- Stay on-brand: Apply Sage's visual guidelines, including the correct colours, typography, logos, icons, and illustrations.
- Localise: Adapt the same asset for different markets using approved translation memory.
- Export: Download the result as an SVG and continue working with it in Figma.
- Animate: Separate UI layers for use in product tours.
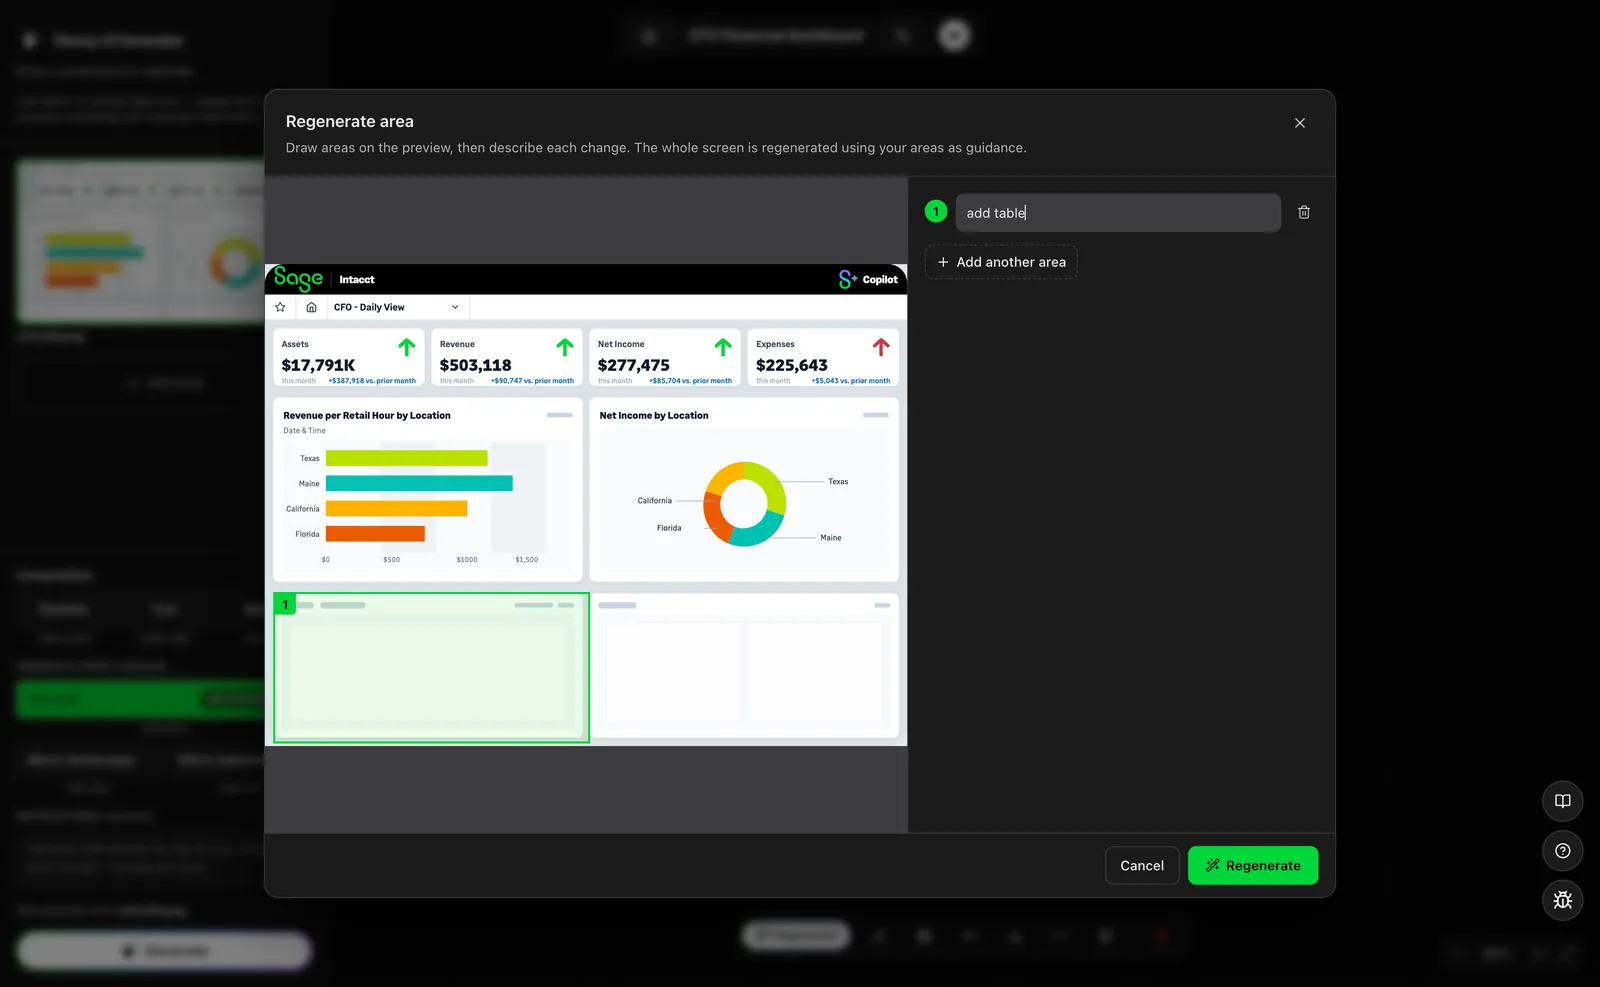
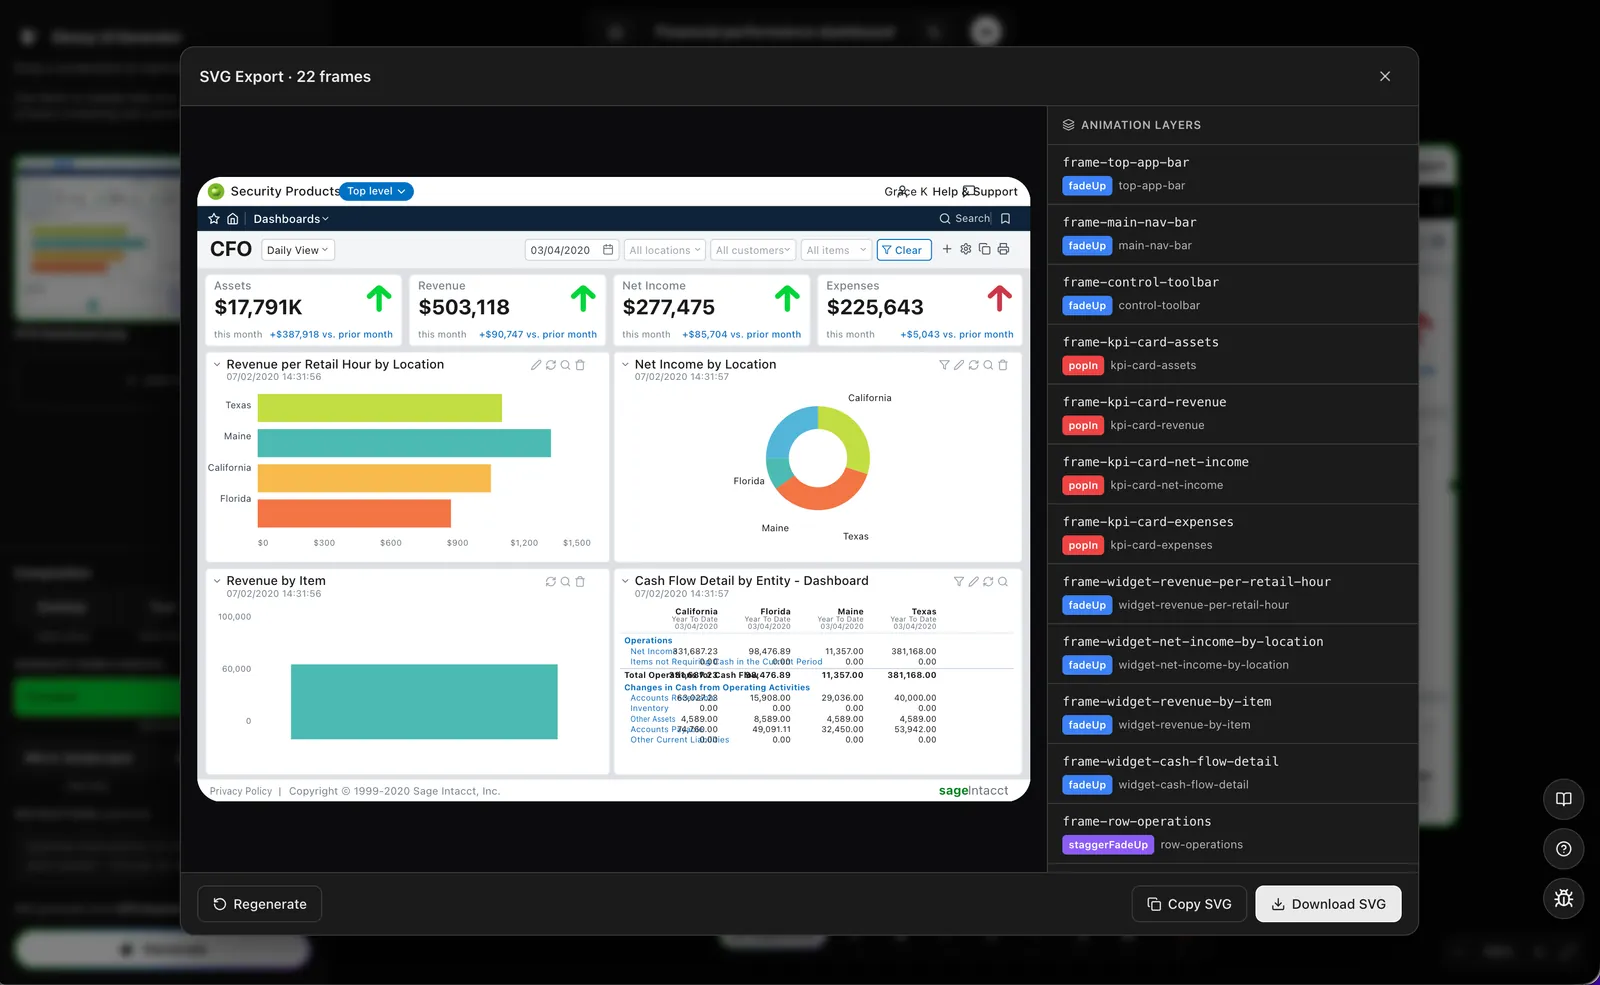
EXPORT
Making the output usable
Generating a good-looking screen was only part of the problem. Designers also needed to take the asset out of the tool and use it in their actual workflow.
Early SVG exports sometimes looked blurred or lost important details, like charts that looked wrong, even when the preview looked correct. I built a custom HTML-to-SVG exporter to make the handoff more reliable.
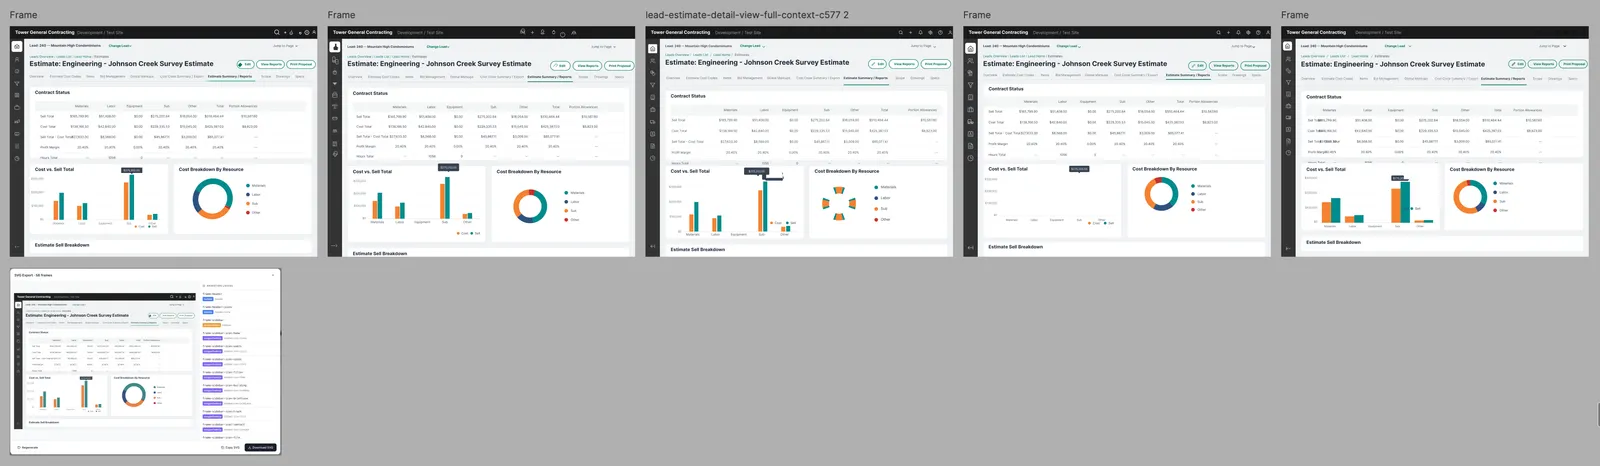
Localisation introduced another challenge. Longer translations, particularly in French, could affect the layout. Connecting approved translation memory helped keep copy consistent, but visual review was still necessary.
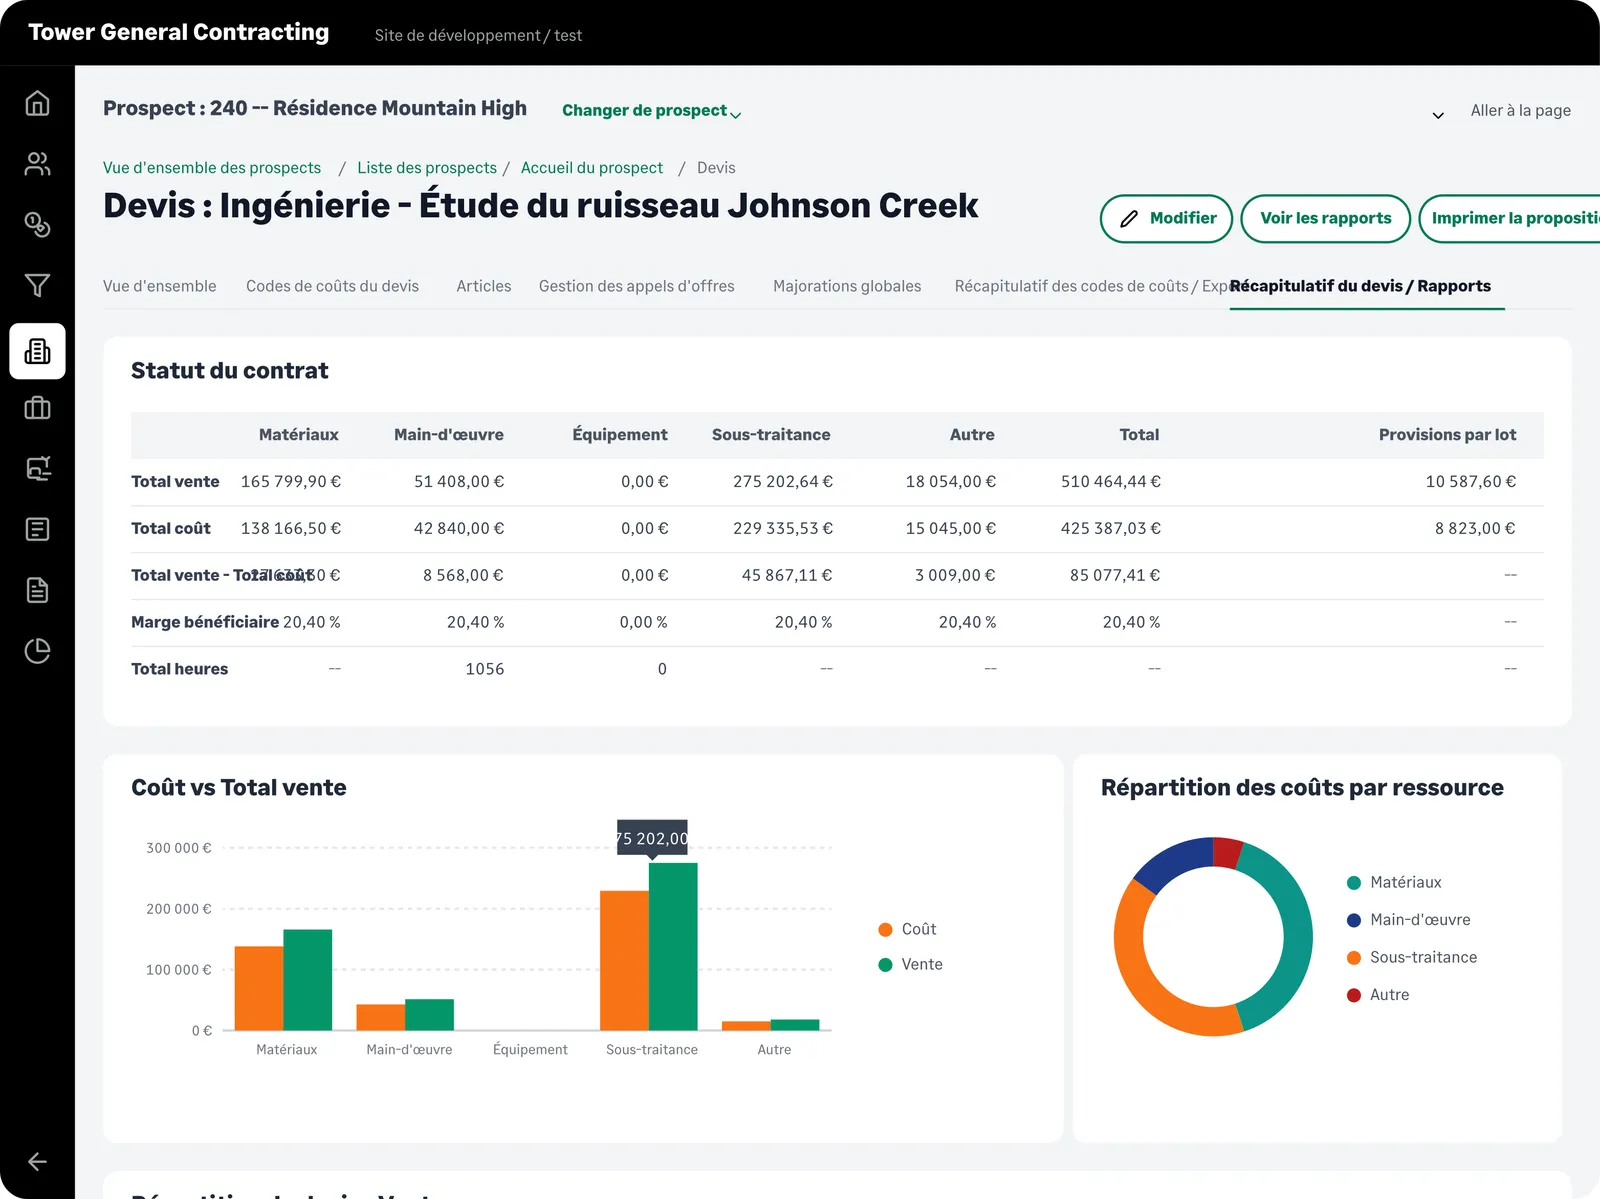
The goal wasn't just to generate a screen. It was to create something designers could actually use.
RESULT
From an hour to two minutes
Before · by hand · 30–60 min per screen
- Screenshot
- Rebuild in Figma
- Apply brand rules
- Repeat for each market
- Export
After · Glossy UI Generator · about 2 min
- Screenshot
- Generate on‑brand
- Refine
- Localise
- Export SVG
The process went from 30–60 minutes per screen to about two minutes.
The outcome
What started as an experiment became a tool used by teams beyond design.
- Demand: The beta filled all 30 available seats, followed by a waitlist.
- Adoption: Sage's web team adopted the tool and created its own playbook page.
- Visibility: I presented the project at Sage's company-wide AI Show and Tell.
The feedback from designers confirmed the value of solving this problem.
"This is genuinely super helpful cause I've got like 4 product UI tasks this sprint. Saving me so much time it's incredible!"
— Minka, Product Designer, Sage
What I learned
The simplest approach isn't always the first one you think of. Moving away from component-by-component assembly made the tool more flexible.
A good preview isn't enough. The output needs to work in the tools and workflows designers already use.
Knowing when to stop is part of the process. Documenting a failed approach helped me understand the limitations and make better decisions about what to try next.
The interesting part wasn't just making the process faster. It was questioning why we were doing it manually in the first place.
I'm a designer, not an engineer. Building this meant figuring things out as I went, testing ideas, and being willing to change direction when something didn't work.
For me, that's where AI becomes useful: not just speeding up the work we already do, but helping us rethink how we do it.